Overview
At a high level, the Collector core is a Jetty service intended to receive events and persist them to HDFS (Hadoop DFS). It provides additional services such as data validation as well as bucketing. The Collector is the core component to Ning's Analytics data pipeline.
The image below shows how we use it at Ning to gather data: each subsystem (either internal or external) that stores data into HDFS does it via the Collector APIs.
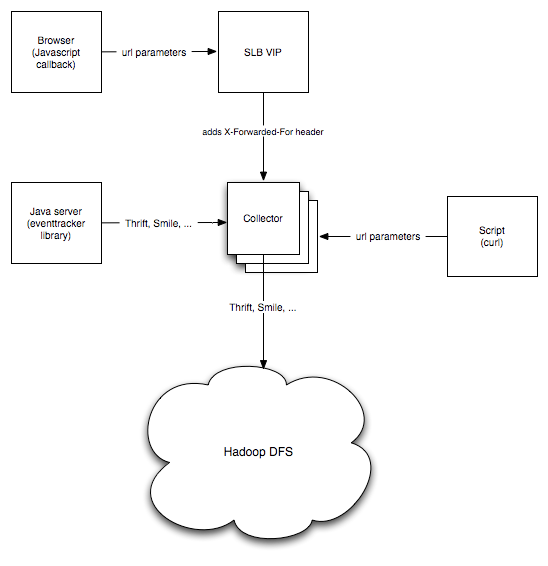
An event is a piece of information that occurred at a certain point in time. It may come from a user's browser, from another Java program, from a script that processes log files, ... In practice, it is a generic series of key-value pairs, defined by its schema. Any event sent to the collector core will show up in Hadoop, regardless if a schema has been defined. To document and maintain schema metadata, we use Goodwill at Ning.
Events are first spooled locally in a local directory (.diskpool by default) for aggregation, before being pushed to Hadoop
Getting started
Self contained jar are published to Maven Central. To start the Collector locally:
java -Dcollector.event-output-directory=/var/tmp/collector -jar metrics.collector-*-jar-with-dependencies.jar
By default, it uses the local Hadoop filesystem. Events will show up in /var/tmp/collector.
Note Available configuration options can be found here.Client side events logging (e.g. from Javascript)
To instrument behaviors and interactions within a browser, the collector supports a GET endpoint. To send an event, issue a GET call on the collector /1 or /2 endpoints. The event collector receives events encoded in the path. It returns a 202 (accepted) to indicate that a best effort will be made to get the event into HDFS (barring catastrophic failures such as flaming machines). If the collector is overloaded, it can return a 503 (temporarily unavailable). For example:
curl -v http://127.0.0.1:8080/1?v=Hello,sWorld
will send a single Hello event, with a single value (the string World). Data is serialized in Thrift format on the way in.
Client-side API Version 1
The primary concern with the url is to keep it smaller than 256 chars to avoid truncation by some browsers.
/1?v=, , ,...
- /1 => 'one' or version one of the api
- each type is exactly 1 character
- empty values are permitted
- empty type is not permitted even with empty value
- the individual type + value will be URL encoded as well (escapes any ,)
- the value of the event in the 'v' parameter is URL encoded
Field Types
| Collector type | Equivalent thrift type | Description | Notes |
|---|---|---|---|
| b | bool | A boolean value (true or false) | we use 0 or 1 |
| 1 | byte | An 8-bit signed integer | |
| 2 | i16 | 16-bit signed integer | |
| 4 | i32 | A 32-bit signed integer | |
| 8 | i64 | A 64-bit signed integer | |
| d | double | A 64-bit floating point number | |
| s | string | A text string encoded using UTF-8 encoding | |
| x | n/a | The value indicates an annotation to fill in that the event collector can compute at receipt of the event |
Custom Type functions
In order to save space in the url, we have a custom type of 'x' which the event collector can fill in. The valid values that may follow x include:
| Annotation value | Meaning | Notes | |
|---|---|---|---|
| date | Current time (millis since epoch) | ||
| host | Referrer host of the request to the Collector (parsed from Referrer header) | ||
| path | Referrer path of the request to the Collector (parsed from Referrer header) | ||
| ua | User-Agent header from request | ||
| ip | IP address parsed from X-Forwarded-For header in request | Requires that you have a load balancer to add this header |
Client-side API Version 2 - Base64 Encode Numbers
Version 2 of the Collector's API encodes numbers as in a custom base64 encoding. The URL format and types are the same as version 1:
/2?v=, , ,...
Encoding schema
We map 0 - 63 to the following chars:
-
0-9
A-Z
_
a-z
So '-' is 0, 'z' is 63. Example:
/2?v=TestEvent,1-,20,4z,810
would result in an event:
type = EventType, byte: 0, short: 1, int: 63, long 128
Server side events logging (e.g. from Java, php)
On the server side, you should use the more efficient resource
POST /rest/1.0/event
which returns 202 if the payload was properly formed. It can also return 503 which means the collector is overloaded and the client should retry. Multiple formats are accepted: Smile, Json, Thrift.
Optionally you may add date= to the query parameters to set a date for the event other than when it is received by the Collector (in ISO8601 format)POST /rest/1.0/event?name=EventType&date=2009-01-02T03:04:05.006Z
Json/Smile (recommended)
The collector accepts Json/Smile events:
{
    "eventName": ..., // Required: event name
    "payload":
    {
        "eventDate": ...,  // Optional, defaults to the timestamp when the event was deserialized on the collector
        "eventGranularity": ..., // Optional, defaults to HOURLY
        "fied1": ..., // Your stuff!
        "field2": ... // Your stuff!
    }
}
For instance:
echo '{ "eventName":"Hello", "payload": { "dontcare": "World" } }' > foo
curl -v -XPOST -H'Content-Type: application/json' -d@foo http://127.0.0.1:8080/rest/1.0/event
The request body can contain multiple events or an array of events:
{ "eventName":"Hello", "payload": { "dontcare": "World" } }
{ "eventName":"Hello", "payload": { "dontcare": "World" } }
{ "eventName":"Hello", "payload": { "dontcare": "World" } }
or
[{ "eventName":"Hello", "payload": { "dontcare": "World" } },
 { "eventName":"Hello", "payload": { "dontcare": "World" } },
 { "eventName":"Hello", "payload": { "dontcare": "World" } }]
Because the body can contains multiple events and a subset of these can be malformatted, the endpoint will always return 202 accepted. You can look for a 199 Warning header though for exceptions on failed events.
For json, use the application/json content-type. For Smile, use application/json+smile.
Raw Thrift via HTTP
You have to specify the event name in the request URL for Thrift:
POST /rest/1.0/event?name=EventType
Use the application/thrift content-type.
Thrift via Scribe
The Collector exposes a non-HTTP Thrift API: the Scribe API. You can log messages directly from Scribe or any Thrift application.
You can test the Thrift endpoint by using the test_collector_thrift_endpoint.py script provided in the Collector source code:
python src/test/py/test_collector_thrift_endpoint.py
Eventtracker Java library
To send event data from Java, you can use the eventtracker library. We use it at Ning to send application specific data, log4j logs, Jetty request logs, etc.
The eventtracker supports most Collector APIs. You can use:
com.ning:metrics.eventtracker-simplefor the GET API version 1 (no local spooling is done)com.ning:metrics.eventtracker-scribefor the Scribe APIcom.ning:metrics.eventtracker-smilefor the Smile and Thrift over HTTP APIs
Overview
Each event accepted via the offerEvent(Event) API is directly serialized to disk using the com.ning:metrics.serialization-writer library for persistency (except when using the GET API version 1). Events are then de-serialized and sent to the collector periodically and/or after a certain number of events have been offered.
The CollectorController class provides the commit() call to force a promotion from the temporary queue of events to the final queue: only events in the final queue are sent (a separate thread wakes up periodically to see if there is anything to send). The commit() call bypasses the promotion rules mentioned above.
One can force a flush to the final queue by calling flush() on the controller object. This forces all events in the queue to be sent remotely.
Serialization to disk is done using the Java Serialization mechanisms (ObjectOutputStream to file). The whole Event object is written to disk. This is not configurable.
Final serialization on the wire is configurable (e.g. Json, Smile, Thrift). You can extend your event to support your own serialization protocol by implementing getSerializedBytes(). These bytes are sent on the wire.
eventtracker-smile usage
To use com.ning:metrics.eventtracker-smile, update your pom.xml:
<dependency>
    <groupId>com.ning</groupId>
    <artifactId>metrics.eventtracker-smile</artifactId>
    <version>4.0.8</version>
</dependency>
You may also need to add com.google.inject.extensions:guice-multibindings (3.0 or higher) and org.skife.config:config-magic (0.9 or higher) as dependencies.
Install the Guice modules:
install(new MBeanModule());
install(new CollectorControllerSmileModule());
install(new CollectorControllerHttpMBeanModule());
Create your event:
// Your POJO
HelloEvent event = new HelloEvent(...);
collector.offerEvent(SmileEnvelopeEvent.fromPOJO("Hello", Granularity.HOURLY, event)); # The String is your event name
# On shutdown make sure to call collector.close() for cleanups
where
SmileEnvelopeEventis an instance ofcom.ning.metrics.eventtracker.smile.com.ning.metrics.serialization.event.SmileEnvelopeEvent(shaded version)collectoris an instance ofcom.ning.metrics.eventtracker.CollectorController(from Guice)
Monitoring
This section describes how to get stats out of a running Collector.
Via HTTP
HTTP is probably the easiest way to get simple stats out of a running collector:
~ > curl http://127.0.0.1:8080/1.0/healthcheck?pretty=true
    {
        "location" : "http://127.0.0.1:8080/1.0/healthcheck",
        "size" : 3,
        "formatVersion" : "1",
        "generated" : "2011-07-26T04:05:21.440Z",
        "items" : [ {
            "type" : "WriterHealthCheck",
            "code" : "OK",
            "message" : "running: true, local files: {/events/MyAwesomeEvent/2011/07/26/04|thrift: 0}, enqueued: 928839, written: 928839, dropped: 0, errored: 0, ignored: 0, flushes: 50212"
    }, {
        "type" : "RealtimeHealthCheck",
        "code" : "OK",
        "message" : "enabled: true, running: true, types: [MyAwesomeEvent, MyAwesomeEvent2], queue sizes: {MyAwesomeEvent: 0, MyAwesomeEvent2: 0}, enqueued: 76257, sent: 76257, dropped: 0, errored: 0, ignored: 852582"
    }, {
        "type" : "HadoopHealthCheck",
        "code" : "OK",
        "message" : "<your hadoop conf>"
    } ]
}
- WriterHealthCheck takes care of writing events to HDFS:
- running: whether the subsystem accepts events
- local files: spool queues currently active with the associated serialization format and number of events waiting to be written to disk
- enqueued: total number of events received by the subsystem
- written: total number of events spooled to disk
- dropped: total number of events dropped due to full queue
- errored: total number of events dropped due to I/O Error
- ignored: total number of events dropped when subsystem was disabled
- pendingFiles: total number of files waiting to be flushed to HDFS
- flushes: total number of files written to HDFS
- RealtimeHealthCheck takes care of sending events to ActiveMQ:
- enabled: whether ActiveMQ has been configured
- running: whether the subsystem accepts events
- types: types of events to forward
- queue sizes: total number of events waiting to be sent
- enqueued: total number of events received by the subsystem
- sent: total number of events sent to ActiveMQ
- dropped: total number of events dropped due to full queue
- errored: total number of events dropped due to ActiveMQ Error
- ignored: total number of events dropped when subsystem was disabled
Via JMX
The 15 seconds test - is a collector falling over?
- com.ning.metrics.collector:name=RTQueueStats, DroppedEvents going up? -> Remote ActiveMQ can't keep up
- com.ning.metrics.collector:name=BufferingEventCollector, LostEvents going up? -> Local disk can't keep up
- com.ning.metrics.collector:name=HDFSWriter, nbLocalFiles going up? -> Can't flush to HDFS fast enough
Load overview
To get a sense on how busy a collector is, look at the com.ning.metrics.collector.hadoop.processing:type=BufferingEventCollector,name=collectEvent bean. It gives you the rate of events being received, across all APIs (the collectEvent function dispatches to both ActiveMQ and HDFS).
The com.ning.metrics.collector:name=BufferingEventCollector bean has more details:
- LostEvents displays the total number of events dropped because of capacity (in-memory queue full)
- QueueSizes displays the total numbers of events currently in memory, waiting to be flushed to disk
The com.ning.metrics.collector:name=WriterQueueStats beans gives write rates to HFDS:
- EnqueuedEvents is the total number of events accepted to the HDFS subsystem
- WrittenEvents is the total number of events buffered locally
- HdfsFlushes is the total number of files written to HDFS
- nbLocalFiles under com.ning.metrics.collector:name=HDFSWriter gives the number of local files not yet flushed to HDFS
Similar stats are available for ActiveMQ, under com.ning.metrics.collector:name=RTQueueStats (stats are further broken down per Event type).
Disabling flushes to ActiveMQ or HDFS
In case of an HDFS outage, the collector can buffer events locally via com.ning.metrics.collector:name=HDFSWriter (see enableFlush and disableFlush). The processLeftBelowFiles action can be used to force a flush (will process all local files, including quarantined ones).
A similar knob for ActiveMQ can be found under com.ning.metrics.collector:name=RTSubsystem.
Stats per API
Stats (acceptance rate and latency) per API are exposed under the com.ning.metrics.collector.endpoint.resources beans:
- com.ning.metrics.collector.endpoint.resources:type=CollectorResource,name=GET_API: GET API
- com.ning.metrics.collector.endpoint.resources:type=Base64CollectorResource,name=GET_Base64_API: Base64 GET API
- com.ning.metrics.collector.endpoint.resources:type=BodyResource,name=POST_Json_API: Json POST API
- com.ning.metrics.collector.endpoint.resources:type=BodyResource,name=POST_Smile_API: Smile POST API
- com.ning.metrics.collector.endpoint.resources:type=BodyResource,name=POST_ThriftLegacy_API: Thrift API, legacy (payload is a ArrayList of ThriftFields)
- com.ning.metrics.collector.endpoint.resources:type=BodyResource,name=POST_Thrift_API: Thrift API
- com.ning.metrics.collector.endpoint.resources:type=ScribeEventRequestHandler,name=SCRIBE_API: Scribe APIs
The beans under com.ning.metrics.collector.endpoint.resources:type=EventRequestHandler drill into stats (success and failure rates) of the GET API deserializer, per payload type:
- com.ning.metrics.collector.endpoint.resources:type=EventRequestHandler,name=BASE_64_QUERY_FAILURE
- com.ning.metrics.collector.endpoint.resources:type=EventRequestHandler,name=BASE_64_QUERY_SUCCES
- com.ning.metrics.collector.endpoint.resources:type=EventRequestHandler,name=DECIMAL_QUERY_FAILURE
- com.ning.metrics.collector.endpoint.resources:type=EventRequestHandler,name=DECIMAL_QUERY_SUCCES
- com.ning.metrics.collector.endpoint.resources:type=EventRequestHandler,name=DEFAULT_FAILURE
- com.ning.metrics.collector.endpoint.resources:type=EventRequestHandler,name=DEFAULT_SUCCES
- com.ning.metrics.collector.endpoint.resources:type=EventRequestHandler,name=JSON_FAILURE
- com.ning.metrics.collector.endpoint.resources:type=EventRequestHandler,name=JSON_SUCCESS
- com.ning.metrics.collector.endpoint.resources:type=EventRequestHandler,name=SMILE_FAILURE
- com.ning.metrics.collector.endpoint.resources:type=EventRequestHandler,name=SMILE_SUCCESS
- com.ning.metrics.collector.endpoint.resources:type=EventRequestHandler,name=THRIFT_FAILURE
- com.ning.metrics.collector.endpoint.resources:type=EventRequestHandler,name=THRIFT_SUCCESS